- Published on
Building a Stock Screener Using Python and Streamlit
- Authors
- Name
- Mohit Appari
- @moh1tt


Introduction
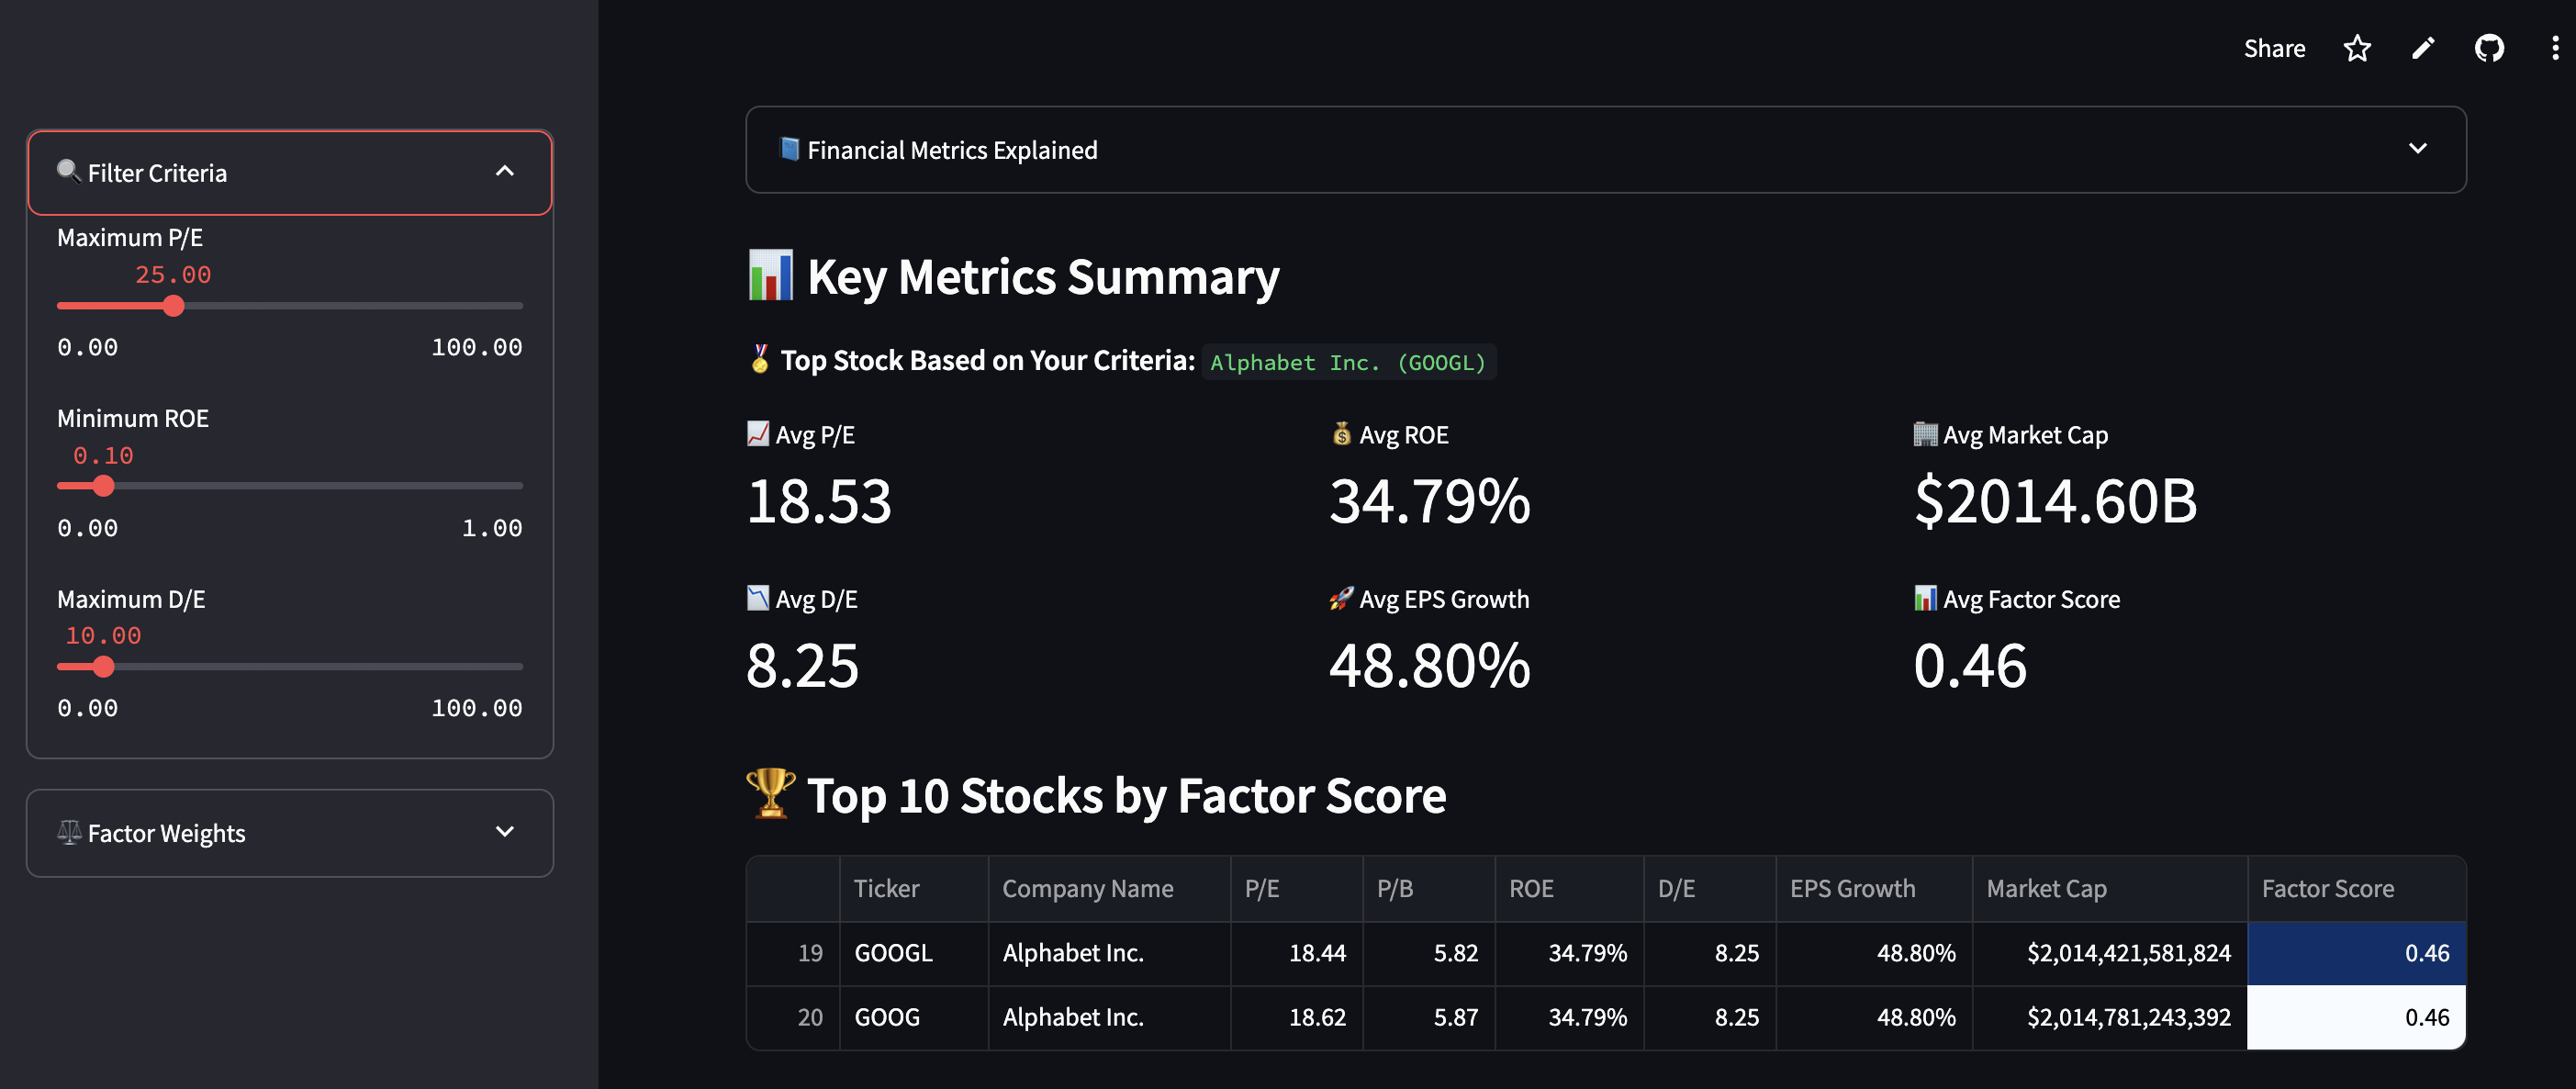
In this blog, we’ll explore how I built a Stock Screener — a tool that allows you to screen and rank S&P 500 stocks based on financial metrics like P/E, ROE, EPS Growth, and more. The project merges Python, data visualization, and financial analysis into a no-code, interactive web app powered by Streamlit.
Whether you’re a retail investor, finance student, or data science enthusiast, this app helps you make data-driven stock decisions with clarity and confidence.
Project Overview
This project focuses on factor-based investing — an approach used by quantitative hedge funds and asset managers to group and evaluate stocks based on characteristics like value, quality, and growth.
What You Can Do With It:
- Filter stocks based on:
- Price-to-Earnings (P/E)
- Return on Equity (ROE)
- Debt-to-Equity (D/E)
- EPS Growth
- Market Cap
- Assign custom weights to each factor and generate a Factor Score.
- View the top 10 ranked stocks and full filtered list.
- Visualize relationships between financial features using:
- Bar charts
- Scatter plots
- Bubble charts
- Market Cap histograms
- Plan your investment with an interactive savings allocator:
- Input your savings
- Get recommendations based on Value, Growth, and Quality strategies
Tools and Libraries
Streamlit– for building the web app UIPandas– data manipulationyfinance– stock data ingestionMatplotlib/Seaborn– visualizationsPython– the glue holding everything together
Install everything with:
pip install -r requirements.txt
GitHub Repository
Check out the full code here: GitHub Repository
Key Features
1. Financial Filters
Users can interactively filter stocks by financial health indicators:
- P/E for valuation
- ROE for profitability
- D/E for risk
- EPS Growth for momentum
2. Custom Factor Scoring
You can assign a weight to each metric to match your investing style — whether you're value-driven, growth-focused, or somewhere in between.
3. Visual Analytics
The app comes with rich visualizations:
- Top 10 stock bar charts
- ROE vs. P/E scatter plot
- Market cap distribution
- Bubble charts for visual stock comparison
4. Investment Planner
Enter your total investable savings and get a personalized investment breakdown across:
- Value (40%)
- Quality (35%)
- Growth (25%)
5. CSV Export
Download your filtered results with a single click to use in Excel, Tableau, or your own analysis workflows.
Challenges and Improvements
- Live data delays: yfinance can occasionally throttle or slow down large requests. Caching helped speed up reruns.
- Outlier handling: extremely high or negative values needed to be clipped or filtered for better scoring logic.
- Sector awareness: adding sector or industry filters could help build more specific screeners.
- Backtesting (future): evaluating past performance of screened portfolios would take this to the next level.
Conclusion
This Stock Screener is more than just a coding project — it’s a data product designed to empower smarter investing. By combining financial theory with interactive technology, I created a platform that gives anyone the tools to think like a quant and act with insight.
What started as a learning project turned into a full-featured app that touches multiple aspects of finance, data science, and product thinking.
Have feedback or ideas? Open a GitHub issue or connect with me on LinkedIn!